R FAQ - common mistakes students make in Senanu’s Intro Bio classes
- Should I read this FAQ first?
- How do I get help with R/RStudio in this class?
- RStudio
- Trouble with your data
- I try re-loading new data, but it still looks like the old data.
- Why can’t R read my (Google) data file?
- R says that an object isn’t found.
- R still says that an object isn’t found!
- R still says an object isn’t found! (aka “Why do I need to change ‘eval=FALSE’ to TRUE?)
- Make sure your data is as you expect
- Data frames and vectors in R
- Doing math with your dataset
- Objects and quotes in R
Should I read this FAQ first?
No! Please start by learning about using RStudio and RStudio.cloud. Then you can go on to the Introduction to R. Come back here if/when you have questions.
How do I get help with R/RStudio in this class?
I recognize that most students in my class have never done any computer programming before. I can help! You’ll need to send me your .Rmd file via email. When you do so, you can either send the file as an attachment OR you can copy-and-paste it into an email message. If you copy and paste, you must use the “Source” mode so that you include all the formatting marks
I try to be very responsive and timely in giving help via email, but it will be in your interest to get started early with R projects so that there’s time for a bit of back-and-forth between us before an assignment is due, so please plan accordingly.
RStudio
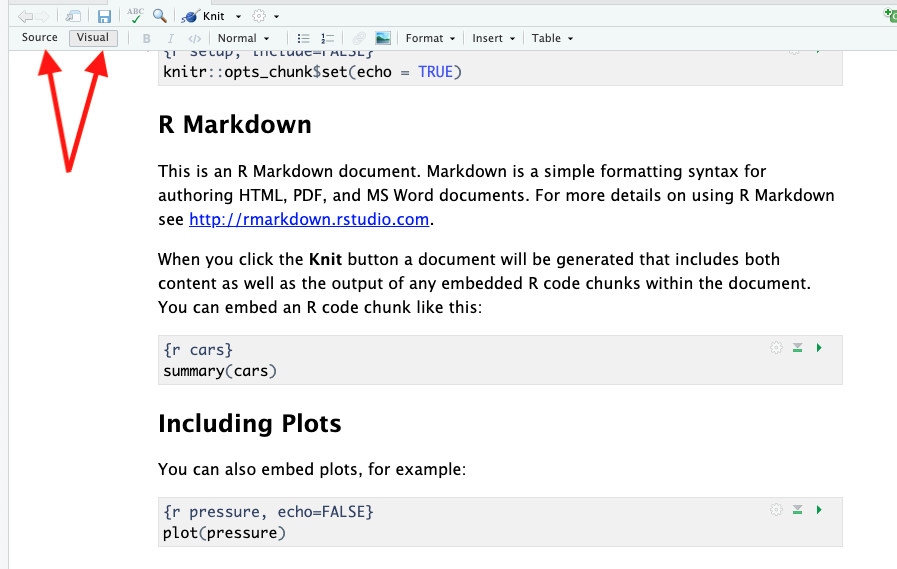
Where is my output going?
RStudio has a lot of flexibility with this and it can be confusing. There is a tiny black arrow to the right of the “knit” arrow. From that menu, you can select “Preview in Window” or “Preview in Viewer Pane”. When you knit, the output will be sent to a new window or to the lower-right quadrant of the RStudio window.
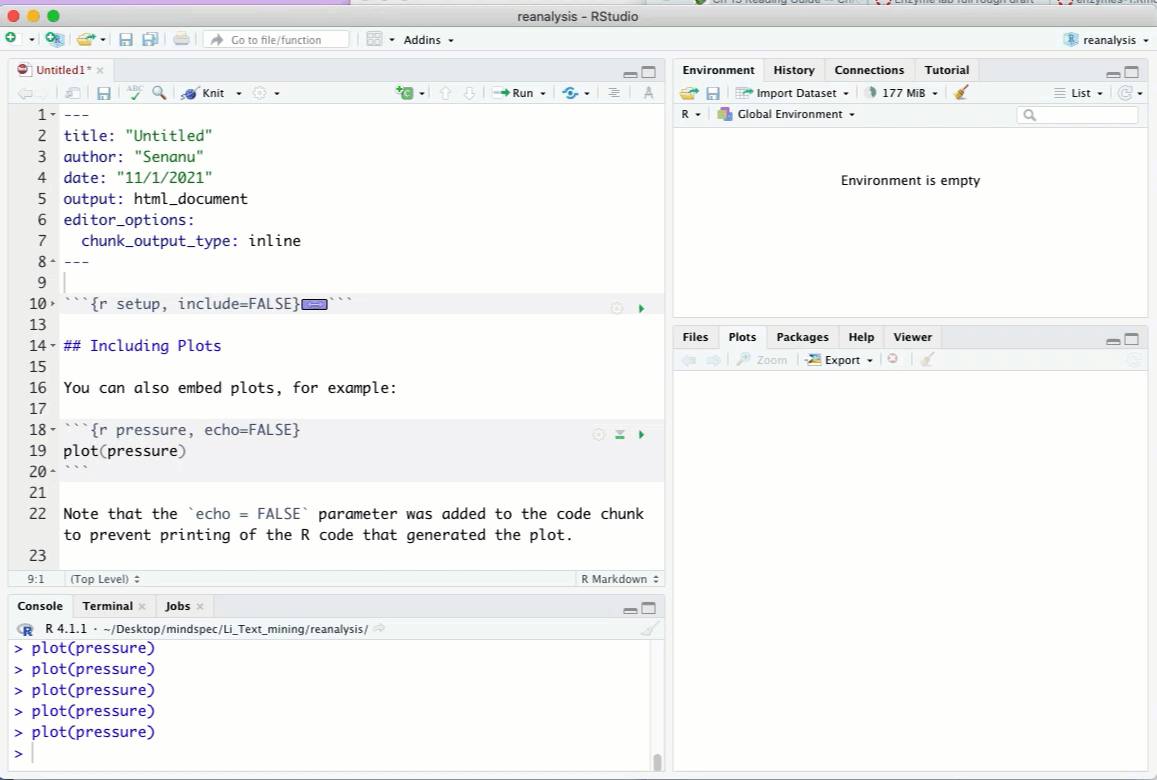
If your individual graphs are not showing up where you expect in the lower-right pane, it may be another cryptic setting. Go to the Tools menu, then “Global Options…”, then select the “R Markdown” tab. Finally, uncheck the “Show output inline for all R Markdown documents”. You can also access this same command from within the RStudio window, as shown here:
Trouble with your data
I try re-loading new data, but it still looks like the old data.
Give Google a few minutes to update things. After you modify your data, it can take several minutes (>5) to update the file as it is accessed by R.
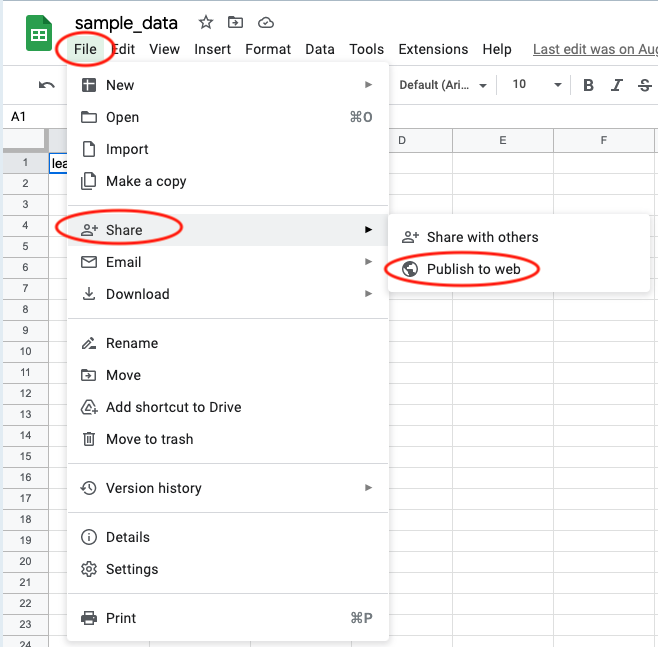
Why can’t R read my (Google) data file?
You may well have not published it properly to the web. Remember, you also need to save it as a .csv file. Please review the instructions in the “Getting your data into R” section of the introduction to R. The 3 main steps are:
- Go to the file menu in Google Sheets and select “File”, then “Publish to Web”.
- Export your data as a .csv file.
- Copy the URL provided and paste it into your Rmd file.
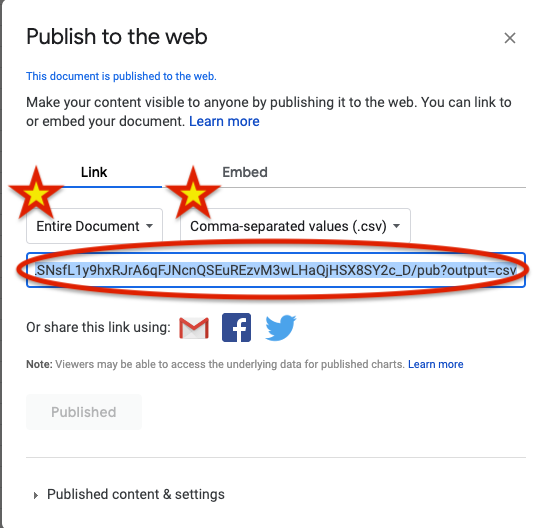
- Make sure the URL ends with “…output=csv”
- Read the file with ‘read.csv(“https://your/url/goes/here”)’. Notice that the URL is entirely enclosed in quotation marks.
R says that an object isn’t found.
If you get an error that looks like:
Error: object 'xxx' not found
that means you’ve never (successfully) assigned data to a variable. Check your spelling, and remember that lower case and upper case letters are different. See also the next question
R still says that an object isn’t found!
See the previous question. Also, check that your data fields ONLY use ‘normal’ characters, and no spaces. Computers interpret spaces as dividers between words (like in natural language), so just don’t use spaces in any variables or at the top of your spreadsheet. You can use underscores (_) and CamelCase (some upper and some lower case letters) to help make your variables easy to read. R also accepts dots in variable names (though many other languages do not).
R still says an object isn’t found! (aka “Why do I need to change ‘eval=FALSE’ to TRUE?)
When you are given R markdown (Rmd) files for this class, I like for them to be knittable, and so all the code needs to work. However, I cannot know ahead of time what you will have named your variables so I instruct the knitter to skip over some sections, and not evaluate them (“eval=FALSE”). When you are ready, and have code that works, you need to instruct the knitter to use that code (“eval=TRUE”). If you leave a code chunk with “eval=FALSE” and the knitter skips it, it may not have learned about a particular variable, and may therefore give you an error below that point saying the variable doesn’t exist. You will need to be conscientious about changing this in every code chunk.
Make sure your data is as you expect
After you read in data from a Google sheet, as I encourage you to do in this class, check that it is as you expect. You may set up a spreadsheet that looks like this:
| potato | original weight | final weight(g) |
|---|---|---|
| 1 | 3.4g | 4.3 |
| 2 | 3.1 | 4.2 |
There are 3 main problems with this:
-
Your column headers have spaces.
Rwill be able to read this, but will eliminate those spaces by inserting a dot (.). Therefore, if you read it in likepotato.dat <- read.csv("URL_to_your_google_file.csv")``you will expect to have a vector called
potato.dat$original weightbut you won’t! You will have a vector calledpotato.dat$original.weightinstead. This is why I strongly encourage you to always name your vectors without spaces. You can separate words with underscores (_), dots (.), or use CamelCase. This way you know what you are getting. See also the related questions here and here -
You have other, non-allowed characters in your header. The parentheses in the
(g)is also not allowed, andRwill usually replace them with a dot, like it does for spaces. Again, the problem is that if you include it, you don’t know what you’ll get. Simply omit such annotations from the file you getRto read. -
You have some non-numeric data in your table.
Rwill see the data3.4gand identify it as text, rather than numbers. Since a single thing in that column is text,Rwill identify the whole vector as text, and you therefore won’t be able to operate on it (such as multiplying, dividing, adding, etc.) in the same way.
With all of these problems, R will still be able to read your data, but it won’t look like it should, and you’ll get problems not when you read it, but further down your code when you try to do something with it. Therefore, after reading data into R, you should always check it by typing its name alone on a line. You can also use str(potato.dat) to look at the ‘structure’ of the data. This will tell you if the data in a particular column is text ‘characters’ (chr) or ‘numeric’ (num).
Data frames and vectors in R
You can follow along with this in RStudio (doing is better than just reading!) by copying and pasting the code chunks into your RStudio Console (bottom left pane in RStudio).
In R, simple datasets are rectangular and are called “Data frames”. The ‘rectangular’ designation means that they can be written in a spreadsheet and each row has the same number of cells and each column has the same number of cells, even if some of them are blank, or “NA”
A good example of this is the cars dataset which is built into R (find out more about the dataset by typing ?cars). You can look at the dataset by simply typing the name cars into the Console or by running the following code chunk, which does the same.
cars
| speed | dist | |
|---|---|---|
| 1 | 4 | 2 |
| 2 | 4 | 10 |
| 3 | 7 | 4 |
| 4 | 7 | 22 |
| 5 | 8 | 16 |
| 6 | 9 | 10 |
| etc. | etc. | etc. |
For now, we don’t want to have to look at so many rows each time we do something, so we’ll just look at the first 5 rows of data, and assign those 5 rows into an object called dat. I generally like to use the name dat because its easy to type and descriptive. I can get just the top rows with the head command, and assign it into the object dat using the assignment operator (<-). Finally, we can look at the contents of dat by typing it alone on a line.
dat <- head(cars, n=5)
dat

  speed dist
1     4    2
2     4   10
3     7    4
4     7   22
5     8   16
6     9   10
Now that you see the contents of dat, you can see that it has speed and dist series. R calls these series ‘vectors’. Of course, you can see the contents of just the vector speed by typing its name, and it’ll print its contents (horizontally for vectors).
dat$speed
[1] 4 4 7 7 8 9
So, we use the dollar sign to signifiy that speed is within dat. Similiarly, dat$dist would get us the dist vector that is held within dat.
Notice that both the dist and speed vectors are the same length, so the data is ‘rectangular’ and can be stored in a data frame (dat is the data frame)
Doing math with your dataset
You can follow along with this in RStudio (doing is better than just reading!) by copying and pasting the code chunks into your RStudio Console (bottom left pane in RStudio). Here, we use an abbreviated version of the cars dataset (which we used in this FAQ)
You can make a new vector by operating on an existing one. For example, if we want to multiply each value by 2, we could do so and save it in a new vector, then look at it. We need to remember to specify which vector we are operating on using the dollar sign ($).
multiply.by.two <- dat$speed * 2
multiply.by.two

[1]  8  8 14 14 16 18
The same can be done for most operators (Multiplication (*), Addition (+), Subtraction (-), Division (/)). We can also use functions, such as taking the natural or base 10 logarithms of each value in the vector:
nat.log <- log(dat$speed)
nat.log

[1] 1.386294 1.386294 1.945910 1.945910 2.079442 2.197225

log.10 <- log10(dat$speed)
log.10

[1] 0.6020600 0.6020600 0.8450980 0.8450980 0.9030900 0.9542425
Because we have a rectangular data frame, we can operate on pairs of values. The following code multiplies together the speed and dist vectors, and saves them in a new vector. Then, we can ‘bind’ together the new vector with the previous data frame to make a single data frame with all 3 vectors. We save this vector with a new name of our choosing (speed.x.dist)
speed.x.dist <- dat$speed * dat$dist
# 'column-bind' the previous data frame with the new vector
dat.2 <- cbind(dat, speed.x.dist)
dat.2

speed dist speed.x.dist
1     4    2            8
2     4   10           40
3     7    4           28
4     7   22          154
5     8   16          128
6     9   10           90
You can combine these pairwise operations with operations using a single value for the whole vector. For example, if you wanted to implement the formula
then you could do it like this:
A <- (dat$speed + dat$dist) * 100
dat.3 <- cbind(dat, A)      # bind the new column to existing data frame
dat.3

  speed dist     A
1     4    2   800
2     4   10  4000
3     7    4  2800
4     7   22 15400
5     8   16 10800
6     9   10  9000
Notice that R follows the rules for precedence, but I like to always use parentheses to make it very clear so that I can read it easily without having to check that R is doing the speed + dist before multiplying by 100.
Objects and quotes in R
When you create something in R, it is known as an ‘object’ and you can refer to it without quotes. Thus, when you read in your dataset and save it in an object called dat, you can manipulate dat without quotes.
dat <- read.csv("https://my_google_spreadsheet_URL")
You need to include the quotes here because the URL is just a sequence of letters and numbers, and that is exactly what R needs to find that web address. But you save it into an object called dat and so R knows that by its real name, not just a sequence of letters.
Now, if you want to use dat for some other command, you don’t need quotes:
plot(x = dat$concentration,
     y = dat$weight,
     xlab = "Some text for the x axis",
     ylab = "Some text for the y axis",
     main = "Some text for a title")
Note here that the object you created (dat) doesn’t need quotes, but when you want to enter text so that R can simply put the text onto the graph, it’ll need quotes because you need to tell R that it is, indeed, just a sequence of letters, and not really a name of anything.