Enzyme Lab
Resource list for this lab
- Writing guides
- Data Analysis Files
- R Markdown file “enzymes.Rmd”.
- HTML website version of Enzymes lab
- R FAQ.
Introduction
This lab is modified from Marini (2005).
The amylase from this lab is derived from animal pancreas or genetically modified bacteria. Your saliva contains amylase, which helps break down starches into smaller saccharides.
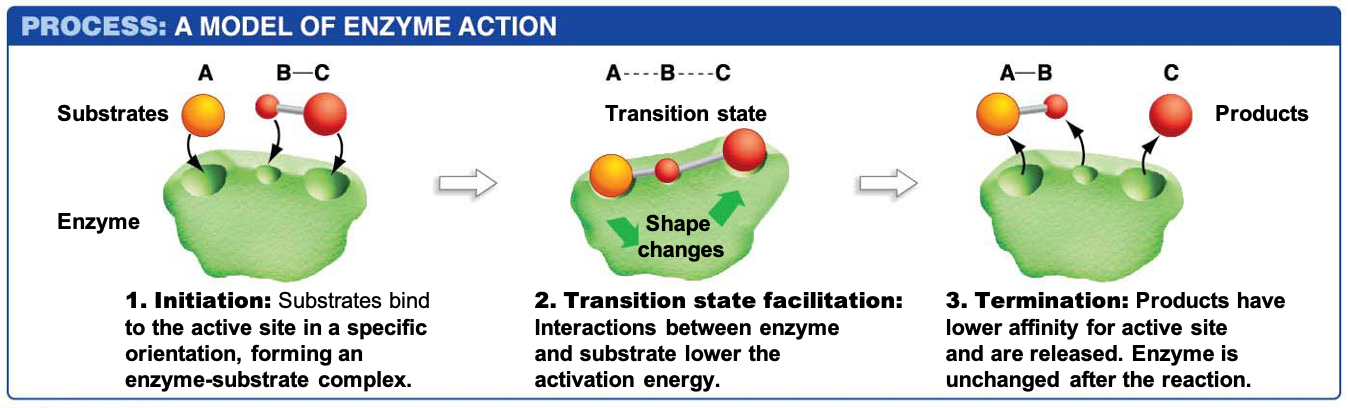
Enzymes are biological catalysts. Although some biological reactions happen spontaneously, the reactions are so slow that organisms require enzymes to speed them up. Like other proteins, the tertiary and quaternary shape plays an important role in enzymatic activity. This is because enzymes bind substrates in particular regions called the ‘active site’ of an enzyme. As the enzyme binds the substrates, it changes shape, bringing the substrates together. Additionally, enzymes stabilize the transition state, the unstable time period when bonds within the reactants are breaking but before the bonds in the products have formed. Stabilizing this transition state lowers the activation energy of the reaction, allowing it to proceed quickly. This model of how enzymes work is known as the ‘induced fit’ model (Figure 1).
In today’s lab, we will investigate the activity of the enzyme α-amylase, which is present in your saliva and pancreas and catalyzes the hydrolysis of starch into maltose, glucose, and other oligosaccharides by breaking the α-1,4-glycosidic linkages of starch.
Part 1: How much amylase is required to digest a fixed amount of starch?
In a previous lab, you investigated the reaction above in a qualitative way: i.e. “Does amylase catalyze the reaction or not?”. Now we are going to take a more quantitative approach so that we can find out how much amylase is required to hydrolyze a certain amount of starch.
- Label 11 test tubes 1-11. Use SHORT test tubes that a micropipettor (p1000) will fit in.
- Put 1 ml pH 7.0 buffer in each tube.
- Put 1ml amylase in the first tube and stir to mix. This first tube will have an amylase concentration of 1/2 relative to the full-strength stock amylase (1ml amylase : 1ml buffer (total volume = 2ml)).
- Take 1 ml from the first tube, and put it in your second tube. This tube will have an amylase concentration of 1/4 the stock (1/2 ml amylase, 1.5 ml stock; 2ml total volume).
- Take 1 ml from the second tube, and put it in your third tube. This tube will have an amylase concentration of 1/8 (1/4 ml amylase : 2ml total volume).
- Continue diluting in this way until you have completed tube 10. This method of dilution is called a serial dilution.
- Remove 1ml from tube 10 so that the total volume in 10 is equal to the others. You may discard this 1ml of solution with your pipette tip.
-
Your dilutions will be:
Tube Dilution Final color 1 1/2 2 1/4 3 1/8 4 1/16 5 1/32 6 1/64 7 1/128 8 1/256 9 1/512 10 1/1024 11 Buffer only - Place all tubes at 37°C and wait for a few minutes so that the temperature of the contents is 37°C.
- In rapid succession, add 1ml 1% starch solution (the substrate) to each tube, and mix.
- Wait for exactly 15 minutes.
-
While you are waiting, calculate how much starch would be in the 1ml 1% starch solution that is in each tube. A 1% solution contains 1g starch for 100g solution (1ml water weighs 1g and the starch solution is essentially the same).
-
While you are waiting, write down a prediction: Do you think that there will be more starch present after 15 minutes in tube 1 or tube 10? You will be adding iodine to the tubes. What color will they turn if they contain starch? What does a lack of starch tell you about the enzymes you introduced to the tube?
- When your 15 minutes has elapsed, add 2 drops of iodine solution to each tube.
- Record the color in the table above.
- We are interested in finding the most dilute tube that is colorless. What is the dilution for this tube? We will call this dilution the “colorless number”.
- Do you think the colorless number would be the same if we added more starch to the mixtures? In which direction would it change?
- Do you think the colorless number would be the same if we stopped the experiment after 5 minutes instead of 15? In which direction would it change?
- We want to find a concentration of amylase that could completely hydrolyze the starch in a few minutes. Write down the concentration of amylase that is 4 times as concentrated as your colorless number. For example, if your colorless number was in tube 7, tube 6 would be twice as concentrated and tube 5 would be 4x as concentrated. You would use this dilution for the subsequent tests.
Write down the number and concentration here: concentration for full hydrolysis in a few minutes:
Part 2: Effect of pH on amylase activity.
- Make a dilution of amylase in pH 7.0 buffer that you calculated in the last step above. You will need about 1 ml diluted amylase. If your dilution is 1:8, then you’ll need 1μl amylase for every 7μl buffer. Figure out how to scale this up to 1ml.
- Place a few drops of iodine solution in each ‘dimple’ of 2 dimple plates. You may want to label the dimples with tape for 30 second intervals (“30s”, “60s”, “90s”, “120s” etc.). This can best be done by making a ‘map’ of the dimple plate on a paper or with chalk on your lab bench.
- Place an empty 1.5 ml microcentrifuge tube in a floating holder in your water bath at 37°C.
- Add 600 μl buffer (pH 7) to the empty tube in the water bath.
- Add 200 μl 1% starch solution. Calculate how many micrograms of starch this is:
- Wait for about 2 minutes for the buffer/starch solution to reach the temperature of the water bath. You don’t need to measure the temperature, just make sure that you give it about 2 minutes.
- Add 60μl diluted amylase to the tube in the water bath and immediately start timing. With your pipette, gently mix the solution. You should leave this tube in the water bath for the duration of the experiment.
- After 30 seconds, take 25μl (from the tube in the water bath) and add it to the iodine in the first dimple.
- Repeat each 30 seconds until no color change is observed in the dimple plate. Record this time (“colorless point”). You may need to quickly rinse your dimple plate between 30s intervals. What does the time point at which there is no color change signify? Run this experiment for a maximum of 10 minutes.
- Calculate the reaction velocity as the number of micrograms of starch hydrolyzed per minute. Use the information you calculated in step 6 above. You will need to do this calculation for each pH tested.
-
Repeat this procedure for pH values of 4, 5, 6, 6.5, 7, 7.5, 8, 9 as available. These are the pH values for the buffer that you add in step 5 above. You should use the same pH7 amylase/buffer mixture from step 1 for all of these.
pH Colorless point (min) velocity (μg starch hydrolyzed per minute) - Use the Rmd file “enzymes.Rmd” to analyze your data.
Part 3: Effect of substrate concentration
This part of the lab will be done on the second day.
- Make another 500μl of your amylase dilution.
- Label 7 microcentrifuge tubes according to the table below.
- Add the specified amount of buffer (pH 7.0). Notice that the total volume in each tube will be 1ml.
- Add the specified amount of starch.
-
Prepare to assay the colorless point for tube #1 as you did previously. Finally add the amylase, mix, and start timing. Repeat for the other tubes. Again, make sure you mix as you add the amylase
Tube Final Starch
Conc (mg/ml)Buffer
pH 7.0 (μl)1% Starch
(μl)Diluted
amylase (μl)1 1.00 870 100 30 2 1.50 820 150 30 3 2.00 770 200 30 4 2.50 720 250 30 5 3.00 670 300 30 6 5.00 470 500 30 7 9.70 0 970 30 -
Record your data in the following table:
Tube Starch Conc (mg/ml) Starch (μg) Colorless point (mins) starch hydrolyzed (μg)/min 1 1.00 2 1.50 3 2.00 4 2.50 5 3.00 6 5.00 7 9.70 - Calculate the amount of starch in the reaction and record your answer in the table in μg.
- Calculate the speed of reaction in μg of starch hydrolyzed per minute.
-
Arrange your data in a table to be imported into R. Your table should look like this (the ‘S’ is capitalized, the ‘v’ is lowercase):
S v 1.00 1.50 2.00 2.50 3.00 5.00 9.70
The ‘S’ represents the substrate concentration in mg/ml and the ‘v’ represents the speed (“velocity”) of the reaction, in μg/min
We are now going to use the data we have to estimate a theoretical maximum reaction rate. This is done by what is known as a Michaelis-Menten curve that was specifically designed to describe enzyme kinetics. It is given by the equation
Where v is the reaction rate, [S] is the concentration of the substrate, Vmax is the maximum reaction rate, and Km is the substrate concentration at half of the maximum reaction speed. You don’t need to memorize these details (or the equation), except to be aware that scientists have used their understanding of how enzymes work in order to describe it mathematically. We will now estimate Vmax.
A graph of this equation is shown below (Fig 2) with the parameters labeled. Remember from class that at low substrate concentrations (at the left of the graph) the reaction rate increases as the concentration of substrate increases because the enzyme molecules spend less and less time with their active sites unoccupied (they ‘search’ for substrate less as the substrate concentration increases). However at high concentrations, the enzyme is ‘saturated’ and is simply working to convert substrate into products as fast as it possibly can. The active site is essentially always full, so increasing the concentration does NOT increase the reaction rate - this is the maximum possible reaction velocity at very high substrate concentrations.
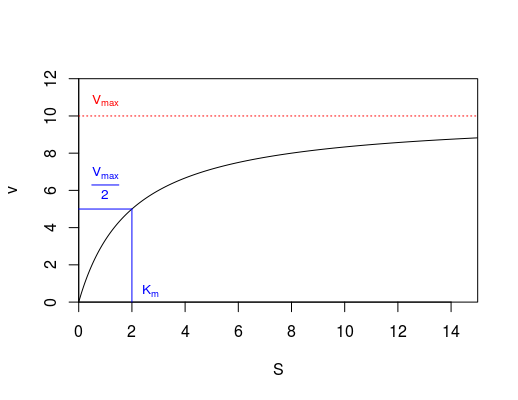
Use the Rmd file ‘Enzymes’ to analyze your data. You will fit the Michaelis-Menten graph to your data to estimate Vmax.
Lab Reports
You will turn in a formal lab report for this lab. As before, we will conduct a peer review of your classmates’ work before the final version is due. Remember that the the more polished it is before the peer review, the more your classmate can improve your paper.
Refer to the previous class materials for how to write your lab report. The exact content of your introduction and discussion sections will be up to you, however here are some suggestions for things that would probably be good and appropriate to address in those sections.
Introduction and discussion
Provide a bit of background about the activity of enzymes. Convince your reader that he/she will learn something useful by reading your paper. Some ideas: What are enzymes made of? How do they work? What is an active site? What is denaturation? Why might there be a maximum rate at which enzymes can catalyze a reaction? What is inhibition and how does it work (though we don’t really deal with inhibition in this lab)? Make sure you state research hypotheses for parts 2 and 3.
What sources of (systematic) error were there? How did these affect your results? What do your results tell you about the activity of enzymes? Can this extend to proteins in general?
Methods
Because this is a long, complicated, multi-part lab report, think carefully about how to structure your methods in order to give enough, but not too much detail. Remember that a reader isn’t interested in how you labeled your tubes! One suggestion is to subdivide your methods section and in one of the earlier subdivisions, describe the assay. Then later in the methods, you can say something like “The speed of the enzymatic reaction was assayed as described above”.
Literature cited
You should find 2 primary literature papers that are somewhat appropriate for the topic of this lab. Please read this guide for help understanding what is and isn’t primary literature, and how to cite it. For each, make sure you include an in-text citation and make sure that you include a “Literature cited” section that has complete, proper citation of the 2 papers.
Some ideas from this lab were developed by Marini (2005).
Marini, I. (2005), Discovering an accessible enzyme: Salivary α-amylase : Prima digestio fit in ore: A didactic approach for high school students. Biochem. Mol. Biol. Educ., 33: 112–116.
Timeline
| Date | What is Due? |
|---|---|
| Mar 11 | Introduction due for peer review. |
| Mar 25 | Full rough draft for peer review |
| Apr 1 | Final Draft due |